Survey Of Oregonians: Education Priorities And Planning (Photo) - 10/02/24
REPORT ALSO AVAILABLE HERE
Introduction
From April 29 to May 20, 2024, the Oregon Values and Beliefs Center (OVBC) conducted a statewide survey of Oregonians’ values, beliefs, and experiences relating to public education priorities and planning. The research was conducted to support Foundations for a Better Oregon and its mission to advance Oregon’s commitment to supporting every child to learn, grow, and thrive.
The question numbers in this document correspond with the accompanying annotated questionnaire and tabs. Due to rounding, percentages reported may not add up to 100% or exactly match the percentages for the same question in the annotated questionnaire and tabs.
Selected questions include noteworthy subgroup variations such as age, gender, area of the state, and racial/ethnic identity. The cross tabulations report subgroup variations for all questions.
OVBC surveys currently use aggregate data to analyze the opinions of Black, Indigenous, and people of color (BIPOC) compared to those who identify as white and no other race. Of course, BIPOC residents are not monolithic; this grouping encompasses myriad races and ethnicities. Thus, these findings should not be taken to imply that all people of color share the same opinions. Disaggregated race/ethnicity data are made available when sample sizes permit reliability.
For the full wording of survey questions, all statistically significant subgroup findings, and respondent quotes, please refer to the accompanying documents: 1) annotated questionnaire; 2) cross tabulations; and 3) verbatim written responses spreadsheet (on request).
Noteworthy Trends
Two data trends stand out as particularly significant in this survey. The first is Oregonians’ remarkable level of agreement regarding the questions and issues fielded in this survey. Historical data—including OVBC surveys dating back to 1992—consistently shows a strong consensus among Oregonians regarding the value of public education, transcending typical demographic and psychographic divisions. Even so, this survey finds agreement frequently rising above 80% and even 90%, revealing an especially high level of public alignment. Even statements with a comparatively lower level of agreement, such as Q4 at 73%, still exceed the 60% threshold normally considered pivotal by political strategists when evaluating the potential success of ballot measures.
The second noteworthy trend is respondents’ unusually low level of uncertainty. Opinion research—again including previous OVBC studies—traditionally shows a “don’t know” or “unsure” response rate of around 10%. In this survey, all but two questions elicited a “don’t know” response rate below 10%, with many questions registering rates as low as 3% or below. Given that this survey’s questions were not highly technical, the low level of uncertainty indicates the respondents’ strong convictions and personal investment in their answers.
Values and Priorities for K-12 Education
(GRAPH ATTACHED IN 2 PARTS: Q3-12 Graph pt1 & pt. 2)
When considering the values and priorities that guide K–12 education, Oregonians overwhelmingly share an overarching view that all students, regardless of their background or circumstances, deserve access to well-rounded and rigorous learning opportunities, as well as safe and inclusive learning environments.
- 92% of survey respondents agree that it is important to provide rich academic experiences to all students, fully including those experiencing a disability (Q11), and 90% agree that schools should support students’ health, safety, and belonging (Q3).
- 93% agree that it is important to provide students a well-rounded education, including world languages, arts, civics, physical education, and life skills (Q8), and 92% believe schools should give students from all backgrounds equal access to advanced courses (Q7). 94% also agree that students, communities, and businesses all benefit when education includes hands-on learning with STEM, the arts, and career and technical education (Q9).
- 90% agree that smaller class sizes are better for students and educators (Q5), and 92% agree on the value of giving students strong support during the transition from middle to high school (Q6).
Although agreement levels are slightly lower, a strong majority of respondents agree on the need to work toward ending academic disparities so that students of all backgrounds can succeed (83%, Q10). Further, 77% agree that all students are better served when schools implemented targeted strategies to support historically underserved students (Q12). Finally, a significant majority favor increasing instructional time for K–12 students (73%, Q4).
- Regardless of urban/rural divides, race/ethnicity, area of the state, the presence of children in the household, and connection to the education field, many Oregonians hold similar views on ending academic disparities (Q10).
- Democrats (60%), respondents earning less than $25,000 (53%), those who speak a first language other than English (53%), people with a high school diploma or less (52%), women (51%), people ages 18–29 (51%), BIPOC respondents (50%), and people connected to the education field (50%) are among those most likely to strongly favor targeted strategies supporting historically underserved students (Q12).
Public Perceptions of K-12 Improvement
(GRAPH ATTACHED: Q13 Graph)
Respondents are more divided—or uncertain—about whether Oregon schools and school districts are taking steps to become stronger and make better use of their resources: 48% agree that they are, while 35% disagree and 17% don’t know (Q13).
- Respondents are divided by age range and education level. 29% of those who are 18–29 agree with the statement, compared to only 13% of those who are 55–64, 7% of those who are 65–74, and 11% of those 75 and over. Of those with a high school graduation or less, 28% strongly agree compared to only 11% of those with a four-year degree or higher.
- Respondents with children in their household are also more likely to generally agree that K-12 schools are taking steps to improve (54%), and less likely to say they don’t know (10%). Meanwhile, respondents without children in their household are somewhat less likely to generally agree with the statement (45%), and more likely to say they don’t know (20%).
K-12 Planning, Improvement, and Accountability Strategies
(GRAPH ATTACHED: Q14-17 Graph)
At the state level, respondents indicated high levels of support for education policies that recognize how rural communities differ from urban and suburban communities (81%, Q14); make it easier for districts to serve students and families even if that requires streamlining state or federal requirements or programs (71%, Q15); ensure schools rely on community knowledge and partnerships to give students from all backgrounds a quality education (84%, Q16); and make sure districts set clear plans and budgets for school improvement (88%, Q17).
- While overall support for Q14 is high and nearly equal across urban, suburban, and rural respondents, the highest level of strong support is seen among respondents in areas that are rural (53%) or rural changing to suburban (57%). There is also higher strong support among people ages 55–64 (52%), 65–74 (54%), and 75+ (56%).
(GRAPH ATTACHED: Q18-22 Graph)
When considering long-term planning for schools, Oregonians show strong enthusiasm for setting ambitious yet realistic goals for academic progress and outcomes (65% strongly support) as well as for reviewing whether school districts and charter schools are reaching their goals over the next five years (58% strongly support) (Q18–Q22).
- To a lesser degree, Oregonians strongly support school leaders using evidence-based best practices to inform their planning (55% strongly support), and school districts and charter schools being held accountable for meeting their goals over the next five years (55% strongly support). The overall support level remains high for every initiative presented in Q1–Q22.
- Amid high levels of support for every listed initiative, Oregonians are least enthusiastic about using detailed student data—academic data broken down by race or family income, for example—to inform long-term planning for schools (17% at least somewhat oppose).
(GRAPH ATTACHED: Q23-24 Graph)
Most Oregonians consider access to clear and transparent district and charter school plans and budgets important (92% consider it at least somewhat important). They similarly value evidence that school leaders are equitably allocating public funds to enhance education for all students (89% answering at least somewhat important). Only a small fraction (less than one-tenth) of Oregonians regard these concepts as unimportant (Q23–Q24).
(GRAPH ATTACHED: Q25-29 Graph)
When it comes to addressing challenges in schools and school districts, respondents clearly prioritize dynamic and supportive interventions by the Oregon Department of Education (ODE). The most favored approach is providing more support and assistance to struggling schools and districts, with 43% ranking this as their top choice (average score of 2.07). Close behind, 27% of Oregonians prefer balancing the right amount of challenges and support to improve struggling schools and districts, ranking this approach as their first choice (average score of 2.23) (Q25–Q29).
- In contrast, punitive measures such as withholding funding or revoking licenses are far less favored, with only 5% ranking this as their top choice (average score of 4.03). Similarly, a hands-off approach by ODE garners little support, with just 8% ranking it as their first choice (average score of 4.00).
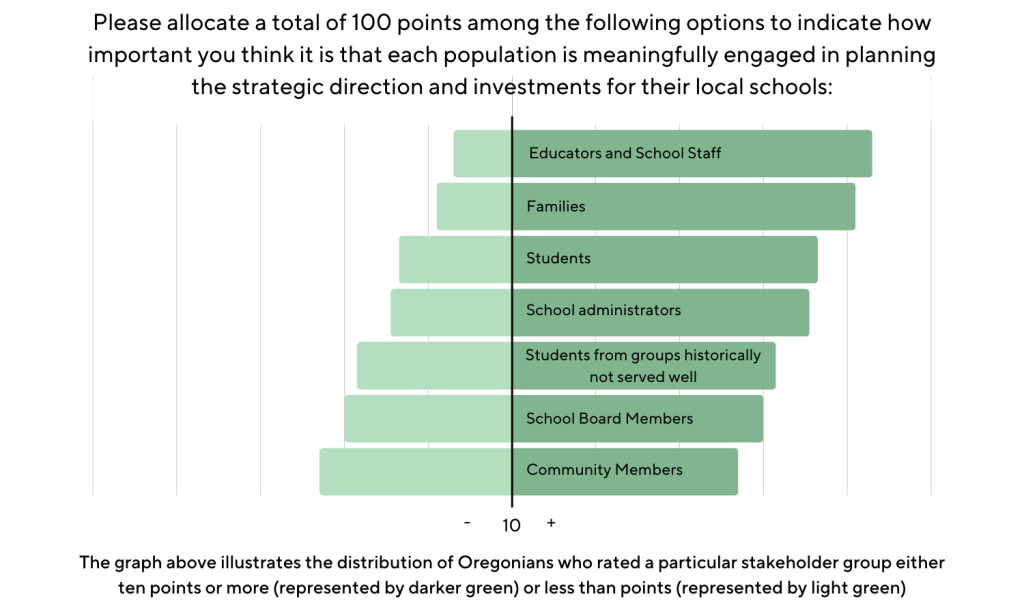
(GRAPH ATTACHED: Q30-37 Graph)
When it comes to strategic planning and deciding investments for local schools, Oregonians emphasize the importance of gathering input from a range of stakeholders—especially educators, school staff, students, and families.
- Oregonians view educators and school staff as the most important people to engage (average score of 19 out of 100). Student engagement follows closely (average score of 18), and engaging students’ families is seen as only slightly less important (average score of 16) (Q30–Q37).
On average, Oregonians assign at least 10 points out of 100 to each stakeholder group, underscoring the value of input from all stakeholders. A majority of respondents gave every group a minimum of 10 points.
- Interestingly, while students receive a higher average score than families, they were also more likely than families to receive a score below 10.
- School board members and other community members are the groups most likely to receive fewer than 10 points, likely reflecting community engagement concerns expressed in the open-ended responses to Q1.
Notably, all groups received the maximum 100 points from at least one respondent with the exception of school board members, whose highest score was 70.
- Students were most likely to receive the full 100 points (2%), followed by families (1%). The relatively small percentage of respondents who allotted the full 100 points to a single group indicates strong support for broad community engagement with no specific group dominating the process. The somewhat even dispersal of points among all groups underscores the widespread support for involving all stakeholders in shaping strategic direction and investments for local schools.
Value of Community Engagement in K-12 Education
Most Oregonians agree that community engagement helps schools make better decisions (Q1). Proponents often emphasize the benefits of drawing on the community’s broad base of knowledge, experience, and diverse perspectives to develop a comprehensive understanding of student needs. Many respondents discuss community engagement as a way of holding school districts accountable, while others highlight the duty of school districts to serve the broader community by asking for their input (Q1).
“Yes, I believe it helps, because we are able to hold the districts accountable, and make sure they do what is in the best interest of our children.”
Woman, age 30-44, Klamath County, White
“Yes I do. Not just parents and teachers, but education involves an entire community. The success of students impacts everyone. There is a wealth of knowledge within the community that should be heard and considered.”
Man, age 75+, Multnomah County, White
“Yes! Education doesn’t happen in a vacuum. Community engagement is needed, and the needs/wants of that community should be supported (as long as it is in the best interest of the students & equitable).”
Non-binary or gender non-conforming, age 18-29, Tillamook County, White
Yes. School districts should reflect the needs of the communities they serve.”
Man, age 30-44, Umatilla County, Native American, American Indian, or Alaska Native, White
Still, some Oregonians express mixed or negative feelings about community involvement, citing concerns over logistical challenges and the credibility of community members in guiding educational decisions. Many Oregonians also worry about the possibility of community input being improperly politicized or selfishly motivated (Q1).
“Not really. Too many of the people wanting to have input have not taken advantage of a decent education themselves and are only repeating what their current “leaders” spout.”
Woman, age 65-74, Clackamas County, White
“I believe that it can help schools make better decisions, however it requires a lot from both sides. Community members are not always well-informed and schools do not always listen or act. Schools may be operating with other priorities in mind.”
Woman, age 55-64, Deschutes County, White
“No. Most do not want to do the hard work of learning about school finance, debt/debt service, collective bargaining or the myriad state & federal regulatory requirements to be fluent enough to participate, let alone contribute. School districts don’t have the staff time to effectively provide this either. Instead, for better or worse, relying on elected boards & volunteer budget committees remains the best source for outside input.”
Man, age 65-74, Multnomah County, White
“Not really, education should be decided by experts and those employed in education.”
Man, age 30-44, Multnomah County, Asian and Hispanic or Latino/a/x
- People connected to Oregon’s education system—whether through their own employment or that of someone else in their household—are enthusiastic about community engagement and its benefits. However, they also express a slightly higher level of concern about both the effectiveness and the practical challenges of community engagement compared to those not connected to the education system through employment.
- People whose households include students from historically underserved communities respond similarly to those who do not have these students at home. Both segments agree on the importance of community engagement to educational outcomes, recognize accountability as a key benefit, and value diverse perspectives. However, people with ties to historically underserved students are more likely to be skeptical about the effectiveness of community engagement efforts that lack a rigorous and equitable process. They place greater emphasis on ensuring school district decisions are constructively informed by the lived experience and expertise of community members, and that community engagement processes authentically include the voices of historically underserved students and families.
Hopes for Improving K-12 Education
When discussing their greatest hopes for improving K-12 education, many Oregonians emphasize how important it is for schools to offer practical experiences that align with students’ career interests. Others focus on equipping students with a versatile set of foundational skills (like reading and basic math; social and emotional learning; and critical thinking skills) in preparation for the future. Oregonians also mention concerns over teacher shortages, the declining mental health of students, school safety, the politicization of the school environment, and students being left behind academically (Q2).
“They can give them practical experiences in the fields they want to pursue.”
Man, age 45-54, Coos County, White
“To be well versed and ready to go to college, or to start a career with what knowledge they have.”
Woman, age 30-44, Crook County, Native American, American Indian, or Alaska Native, White
“Simply hire more teachers because there is a lack of teachers there’s a lack of students being able to learn at a high rate of education. Unfortunately, a lot of kids are looked over. It needs to be a better monitoring system for kids from K12.”
Man, age 55-64, Marion County, Black or African American
“My greatest hope is that the adults in our local communities can come together and agree on common goals and standards for our children to work towards, removed from political strategizing and social engineering.”
Woman, age 45-54, Yamhill County, White
“Children’s mental health is at high risk according to long term statistical trends (I am a mental health provider and keep up with research.) My greatest hope is that students have ready access to counseling and are taught mental health care in health classes. Parents need to be offered training in how to manage in mental health for their families in their household.”
Woman, age 65-74, Multnomah County, White
“Above all, teach critical thinking skills. Young people need to be prepared to function in a complex and difficult society that is constantly changing.”
Man, age 55-64, Washington County, Prefer not to answer
“I hope that it can be a safe place for students of all kinds.”
Man, age 30-44, Clackamas County, Asian
- People with a household relationship to historically underserved students generally have similar hopes for education system improvements as people who have no students in their households or whose students are not considered historically underserved. However, they place are a stronger emphasis on hiring more diverse educators and on promoting equitable and inclusive learning environments.
- Oregonians employed in education—or with household members employed in education—stressed the value of addressing the inadequacies of the current funding model (especially in regard to administrative costs); strengthening teacher and student support; and shifting away from standardized, one-size-fits-all approaches. They also cited the importance of personalized learning, mental health support, community engagement, and reevaluating traditional educational models.
- Respondents who are connected to the education field and those who aren’t both call for equitable access to quality education along with a more supportive and responsive educational environment.
Research Methodology
The online survey, which took approximately 10 minutes, was completed by 1,626 Oregon residents ages 18+. This is a sufficient sample size to assess general opinions as well as to review findings by multiple subgroups.
Respondents were contacted through professionally maintained online panels. Quality control measures included questionnaire pre-testing, validation, and real-time response monitoring. A representative sample was achieved by setting demographic quotas and weighing data by area of the state, gender, age, race/ethnicity, and education.
Statement of Limitations
Any sampling of opinions or attitudes is subject to margin of error—a standard statistical calculation of differences between the sample and total population at a confidence interval (or probability) calculated as 95%. This means that there is a 95% probability that the sample taken for this study would fall within the stated margin of error if compared with the results of surveying the entire population. This survey’s margin of error for the full sample is ±2.43%.